| 0 | 1 | 2 | 3 | 4 | 5 | 6 | 7 | 8 | |
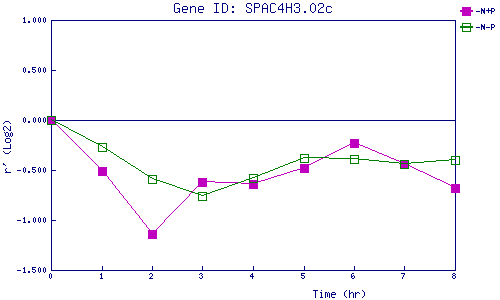
| -N+P | 0.000 | -0.509 | -1.144 | -0.622 | -0.637 | -0.475 | -0.231 | -0.444 | -0.675 |
| -N-P | 0.000 | -0.274 | -0.590 | -0.762 | -0.577 | -0.376 | -0.386 | -0.445 | -0.398 |
|
-N+P: Nitrogen starved in the presence of P-factor -N-P: Nitrogen starved in the absence of P-factor |