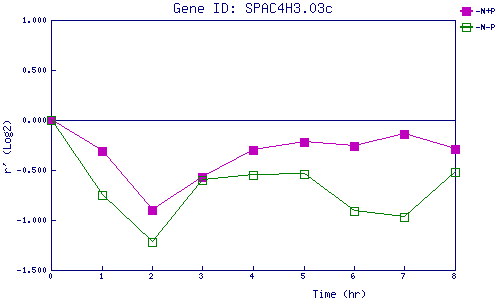
| 0 | 1 | 2 | 3 | 4 | 5 | 6 | 7 | 8 | |
| -N+P | 0.000 | -0.310 | -0.901 | -0.572 | -0.296 | -0.216 | -0.258 | -0.135 | -0.293 |
| -N-P | 0.000 | -0.747 | -1.220 | -0.604 | -0.550 | -0.542 | -0.911 | -0.973 | -0.525 |
|
-N+P: Nitrogen starved in the presence of P-factor -N-P: Nitrogen starved in the absence of P-factor |