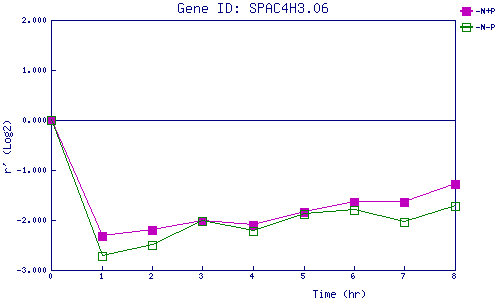
| 0 | 1 | 2 | 3 | 4 | 5 | 6 | 7 | 8 | |
| -N+P | 0.000 | -2.314 | -2.200 | -2.019 | -2.095 | -1.834 | -1.642 | -1.630 | -1.276 |
| -N-P | 0.000 | -2.722 | -2.503 | -2.019 | -2.229 | -1.877 | -1.810 | -2.033 | -1.710 |
|
-N+P: Nitrogen starved in the presence of P-factor -N-P: Nitrogen starved in the absence of P-factor |