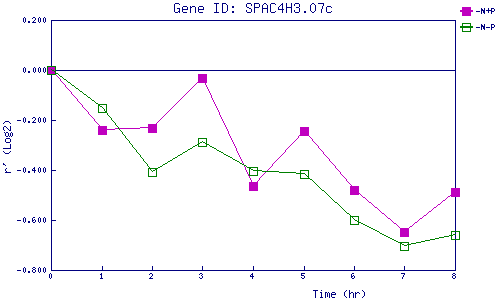
| 0 | 1 | 2 | 3 | 4 | 5 | 6 | 7 | 8 | |
| -N+P | 0.000 | -0.241 | -0.233 | -0.030 | -0.465 | -0.243 | -0.478 | -0.646 | -0.487 |
| -N-P | 0.000 | -0.153 | -0.409 | -0.288 | -0.404 | -0.418 | -0.600 | -0.703 | -0.660 |
|
-N+P: Nitrogen starved in the presence of P-factor -N-P: Nitrogen starved in the absence of P-factor |