pyk1
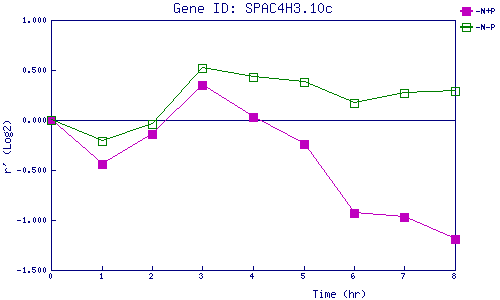
| 0 | 1 | 2 | 3 | 4 | 5 | 6 | 7 | 8 | |
| -N+P | 0.000 | -0.443 | -0.144 | 0.353 | 0.026 | -0.235 | -0.933 | -0.972 | -1.190 |
| -N-P | 0.000 | -0.211 | -0.035 | 0.520 | 0.431 | 0.375 | 0.170 | 0.269 | 0.294 |
|
-N+P: Nitrogen starved in the presence of P-factor -N-P: Nitrogen starved in the absence of P-factor |