Sp-snR62-sno
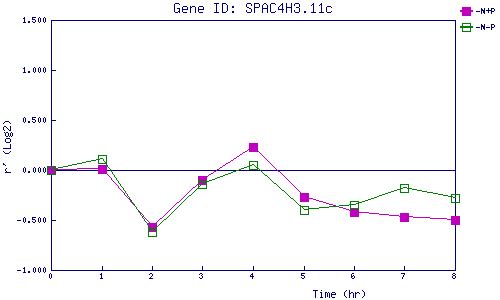
| 0 | 1 | 2 | 3 | 4 | 5 | 6 | 7 | 8 | |
| -N+P | 0.000 | 0.010 | -0.566 | -0.095 | 0.233 | -0.266 | -0.425 | -0.473 | -0.500 |
| -N-P | 0.000 | 0.109 | -0.615 | -0.139 | 0.051 | -0.395 | -0.346 | -0.178 | -0.279 |
|
-N+P: Nitrogen starved in the presence of P-factor -N-P: Nitrogen starved in the absence of P-factor |