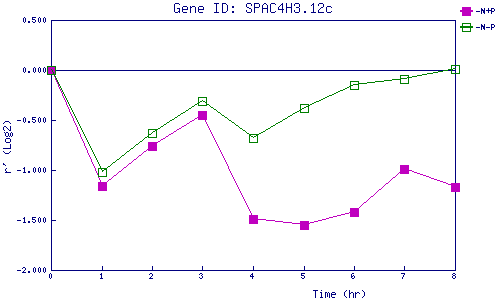
| 0 | 1 | 2 | 3 | 4 | 5 | 6 | 7 | 8 | |
| -N+P | 0.000 | -1.162 | -0.760 | -0.450 | -1.487 | -1.548 | -1.425 | -0.989 | -1.172 |
| -N-P | 0.000 | -1.016 | -0.631 | -0.308 | -0.678 | -0.380 | -0.147 | -0.088 | 0.013 |
|
-N+P: Nitrogen starved in the presence of P-factor -N-P: Nitrogen starved in the absence of P-factor |