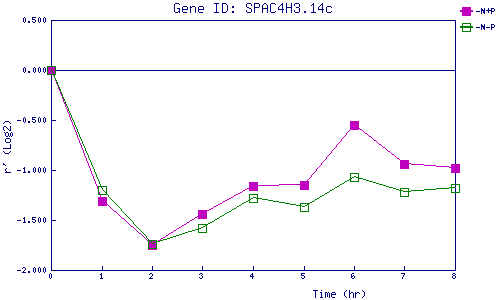
| 0 | 1 | 2 | 3 | 4 | 5 | 6 | 7 | 8 | |
| -N+P | 0.000 | -1.308 | -1.753 | -1.441 | -1.164 | -1.153 | -0.546 | -0.936 | -0.978 |
| -N-P | 0.000 | -1.204 | -1.738 | -1.578 | -1.276 | -1.369 | -1.072 | -1.220 | -1.183 |
|
-N+P: Nitrogen starved in the presence of P-factor -N-P: Nitrogen starved in the absence of P-factor |