rps8-2 rps802
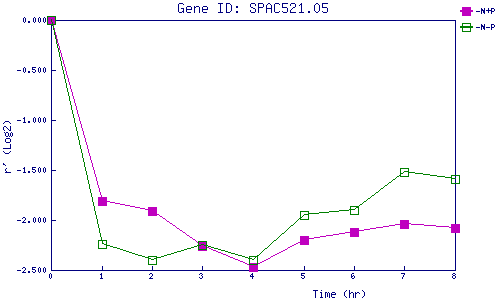
| 0 | 1 | 2 | 3 | 4 | 5 | 6 | 7 | 8 | |
| -N+P | 0.000 | -1.806 | -1.906 | -2.257 | -2.469 | -2.196 | -2.119 | -2.035 | -2.083 |
| -N-P | 0.000 | -2.245 | -2.405 | -2.247 | -2.395 | -1.947 | -1.895 | -1.523 | -1.590 |
|
-N+P: Nitrogen starved in the presence of P-factor -N-P: Nitrogen starved in the absence of P-factor |