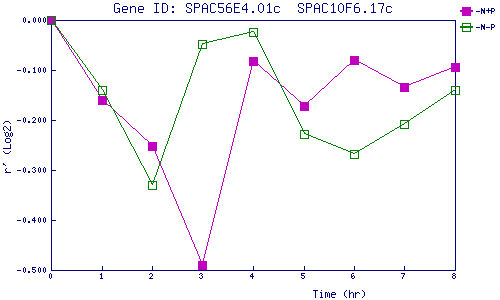
| 0 | 1 | 2 | 3 | 4 | 5 | 6 | 7 | 8 | |
| -N+P | 0.000 | -0.159 | -0.253 | -0.490 | -0.082 | -0.173 | -0.081 | -0.134 | -0.094 |
| -N-P | 0.000 | -0.141 | -0.330 | -0.048 | -0.025 | -0.228 | -0.267 | -0.208 | -0.139 |
|
-N+P: Nitrogen starved in the presence of P-factor -N-P: Nitrogen starved in the absence of P-factor |