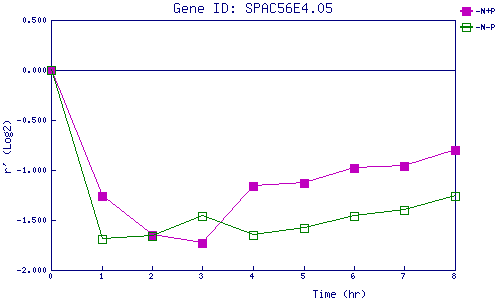
| 0 | 1 | 2 | 3 | 4 | 5 | 6 | 7 | 8 | |
| -N+P | 0.000 | -1.263 | -1.646 | -1.728 | -1.165 | -1.131 | -0.979 | -0.958 | -0.797 |
| -N-P | 0.000 | -1.691 | -1.657 | -1.462 | -1.646 | -1.576 | -1.461 | -1.405 | -1.263 |
|
-N+P: Nitrogen starved in the presence of P-factor -N-P: Nitrogen starved in the absence of P-factor |