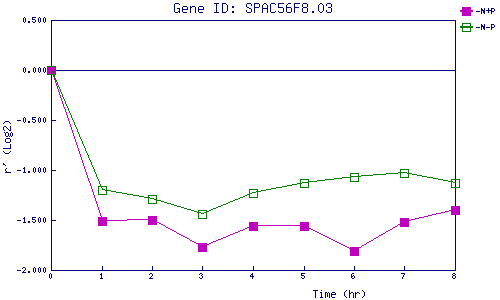
| 0 | 1 | 2 | 3 | 4 | 5 | 6 | 7 | 8 | |
| -N+P | 0.000 | -1.511 | -1.501 | -1.772 | -1.556 | -1.561 | -1.807 | -1.525 | -1.397 |
| -N-P | 0.000 | -1.198 | -1.286 | -1.442 | -1.227 | -1.134 | -1.070 | -1.034 | -1.134 |
|
-N+P: Nitrogen starved in the presence of P-factor -N-P: Nitrogen starved in the absence of P-factor |