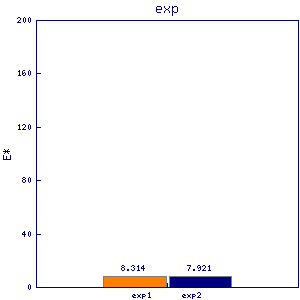
coq2 ppt1
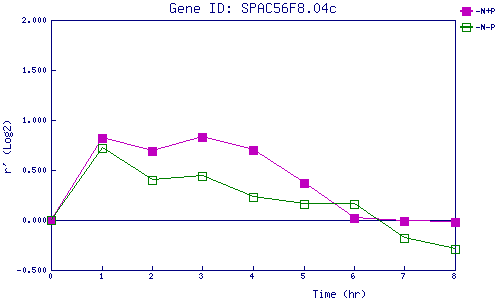
| 0 | 1 | 2 | 3 | 4 | 5 | 6 | 7 | 8 | |
| -N+P | 0.000 | 0.820 | 0.687 | 0.834 | 0.703 | 0.370 | 0.018 | -0.011 | -0.021 |
| -N-P | 0.000 | 0.718 | 0.396 | 0.441 | 0.228 | 0.155 | 0.163 | -0.176 | -0.290 |
|
-N+P: Nitrogen starved in the presence of P-factor -N-P: Nitrogen starved in the absence of P-factor |