| 0 | 1 | 2 | 3 | 4 | 5 | 6 | 7 | 8 | |
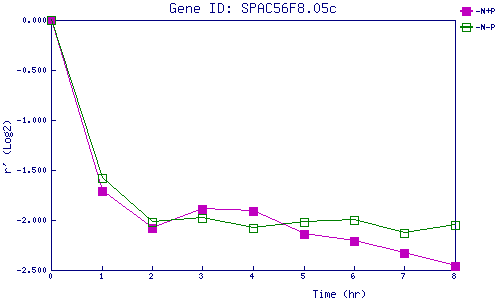
| -N+P | 0.000 | -1.713 | -2.079 | -1.893 | -1.911 | -2.141 | -2.213 | -2.327 | -2.457 |
| -N-P | 0.000 | -1.579 | -2.019 | -1.978 | -2.082 | -2.016 | -1.998 | -2.129 | -2.047 |
|
-N+P: Nitrogen starved in the presence of P-factor -N-P: Nitrogen starved in the absence of P-factor |