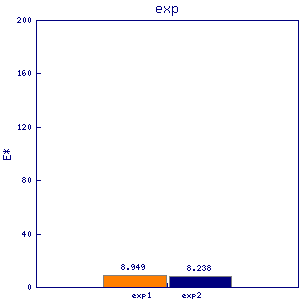
ddi1
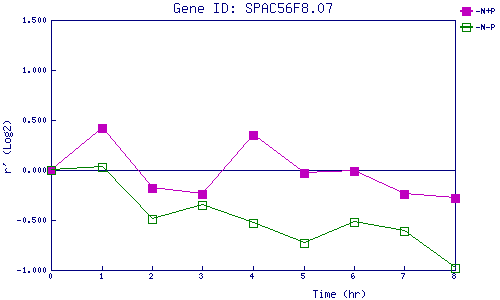
| 0 | 1 | 2 | 3 | 4 | 5 | 6 | 7 | 8 | |
| -N+P | 0.000 | 0.422 | -0.176 | -0.237 | 0.351 | -0.034 | -0.008 | -0.238 | -0.285 |
| -N-P | 0.000 | 0.027 | -0.490 | -0.350 | -0.527 | -0.727 | -0.524 | -0.614 | -0.984 |
|
-N+P: Nitrogen starved in the presence of P-factor -N-P: Nitrogen starved in the absence of P-factor |