mud1 ucp1 ddi1
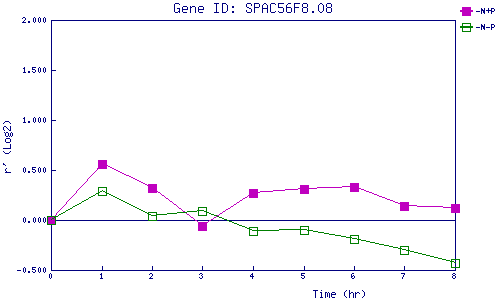
| 0 | 1 | 2 | 3 | 4 | 5 | 6 | 7 | 8 | |
| -N+P | 0.000 | 0.558 | 0.316 | -0.055 | 0.271 | 0.313 | 0.334 | 0.138 | 0.125 |
| -N-P | 0.000 | 0.287 | 0.044 | 0.088 | -0.110 | -0.098 | -0.186 | -0.302 | -0.430 |
|
-N+P: Nitrogen starved in the presence of P-factor -N-P: Nitrogen starved in the absence of P-factor |