| 0 | 1 | 2 | 3 | 4 | 5 | 6 | 7 | 8 | |
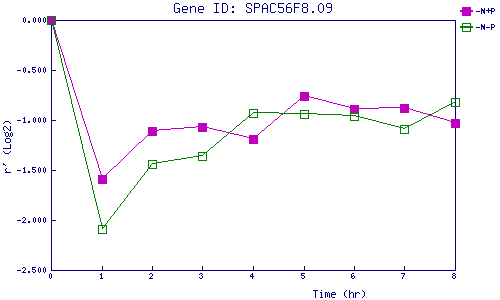
| -N+P | 0.000 | -1.587 | -1.110 | -1.067 | -1.192 | -0.763 | -0.893 | -0.875 | -1.028 |
| -N-P | 0.000 | -2.091 | -1.439 | -1.359 | -0.931 | -0.944 | -0.958 | -1.089 | -0.825 |
|
-N+P: Nitrogen starved in the presence of P-factor -N-P: Nitrogen starved in the absence of P-factor |