| 0 | 1 | 2 | 3 | 4 | 5 | 6 | 7 | 8 | |
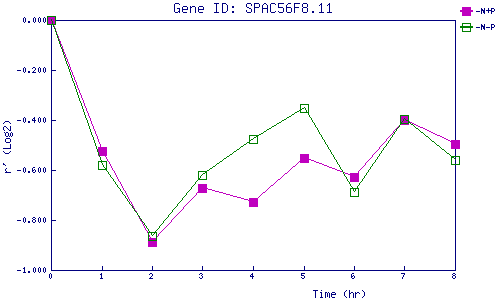
| -N+P | 0.000 | -0.524 | -0.890 | -0.672 | -0.730 | -0.553 | -0.628 | -0.399 | -0.498 |
| -N-P | 0.000 | -0.581 | -0.865 | -0.620 | -0.477 | -0.350 | -0.689 | -0.395 | -0.562 |
|
-N+P: Nitrogen starved in the presence of P-factor -N-P: Nitrogen starved in the absence of P-factor |