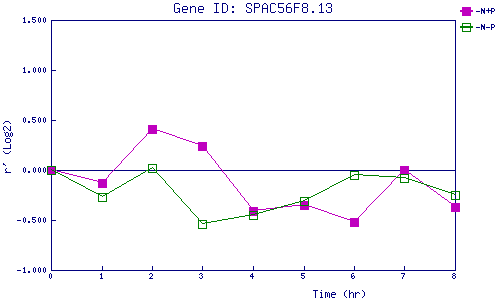
| 0 | 1 | 2 | 3 | 4 | 5 | 6 | 7 | 8 | |
| -N+P | 0.000 | -0.134 | 0.408 | 0.244 | -0.414 | -0.352 | -0.521 | -0.005 | -0.371 |
| -N-P | 0.000 | -0.270 | 0.023 | -0.538 | -0.454 | -0.308 | -0.048 | -0.079 | -0.247 |
|
-N+P: Nitrogen starved in the presence of P-factor -N-P: Nitrogen starved in the absence of P-factor |