| 0 | 1 | 2 | 3 | 4 | 5 | 6 | 7 | 8 | |
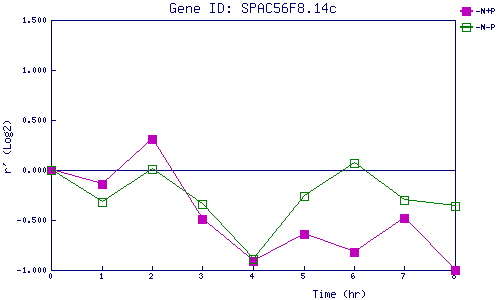
| -N+P | 0.000 | -0.145 | 0.311 | -0.491 | -0.910 | -0.643 | -0.820 | -0.485 | -1.000 |
| -N-P | 0.000 | -0.324 | 0.009 | -0.342 | -0.894 | -0.262 | 0.067 | -0.296 | -0.360 |
|
-N+P: Nitrogen starved in the presence of P-factor -N-P: Nitrogen starved in the absence of P-factor |