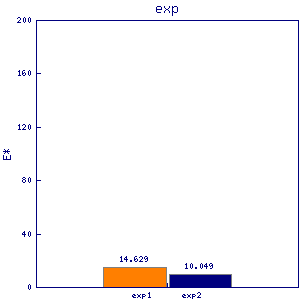
cyp1 cyp2
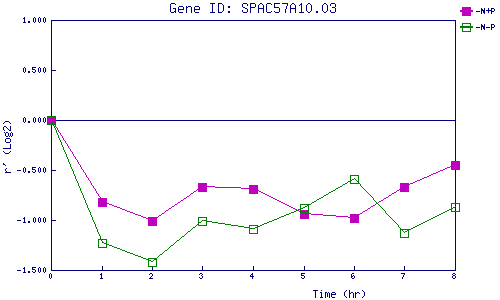
| 0 | 1 | 2 | 3 | 4 | 5 | 6 | 7 | 8 | |
| -N+P | 0.000 | -0.825 | -1.014 | -0.672 | -0.688 | -0.940 | -0.982 | -0.668 | -0.449 |
| -N-P | 0.000 | -1.228 | -1.419 | -1.015 | -1.089 | -0.880 | -0.587 | -1.134 | -0.870 |
|
-N+P: Nitrogen starved in the presence of P-factor -N-P: Nitrogen starved in the absence of P-factor |