sla1
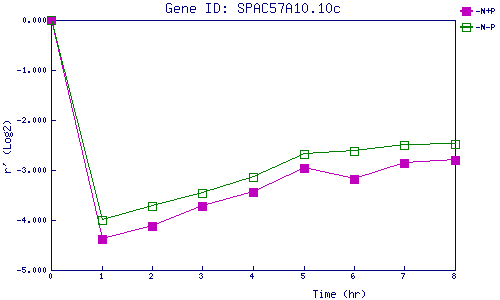
| 0 | 1 | 2 | 3 | 4 | 5 | 6 | 7 | 8 | |
| -N+P | 0.000 | -4.375 | -4.130 | -3.723 | -3.433 | -2.966 | -3.171 | -2.854 | -2.796 |
| -N-P | 0.000 | -4.001 | -3.714 | -3.462 | -3.133 | -2.676 | -2.612 | -2.500 | -2.475 |
|
-N+P: Nitrogen starved in the presence of P-factor -N-P: Nitrogen starved in the absence of P-factor |