ura3
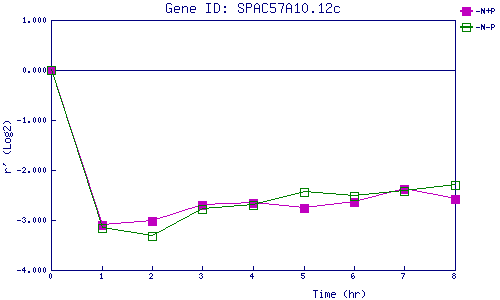
| 0 | 1 | 2 | 3 | 4 | 5 | 6 | 7 | 8 | |
| -N+P | 0.000 | -3.107 | -3.022 | -2.691 | -2.668 | -2.769 | -2.650 | -2.387 | -2.589 |
| -N-P | 0.000 | -3.163 | -3.330 | -2.772 | -2.694 | -2.441 | -2.528 | -2.426 | -2.309 |
|
-N+P: Nitrogen starved in the presence of P-factor -N-P: Nitrogen starved in the absence of P-factor |