pab1 pabp
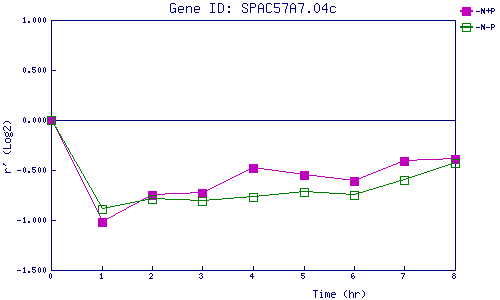
| 0 | 1 | 2 | 3 | 4 | 5 | 6 | 7 | 8 | |
| -N+P | 0.000 | -1.022 | -0.753 | -0.733 | -0.483 | -0.548 | -0.607 | -0.412 | -0.389 |
| -N-P | 0.000 | -0.889 | -0.792 | -0.812 | -0.768 | -0.723 | -0.747 | -0.596 | -0.428 |
|
-N+P: Nitrogen starved in the presence of P-factor -N-P: Nitrogen starved in the absence of P-factor |