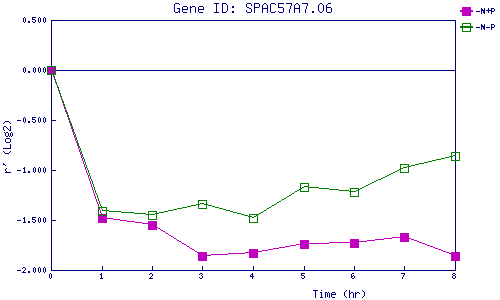
| 0 | 1 | 2 | 3 | 4 | 5 | 6 | 7 | 8 | |
| -N+P | 0.000 | -1.481 | -1.546 | -1.861 | -1.826 | -1.743 | -1.726 | -1.666 | -1.864 |
| -N-P | 0.000 | -1.408 | -1.453 | -1.337 | -1.478 | -1.170 | -1.224 | -0.984 | -0.857 |
|
-N+P: Nitrogen starved in the presence of P-factor -N-P: Nitrogen starved in the absence of P-factor |