sec21
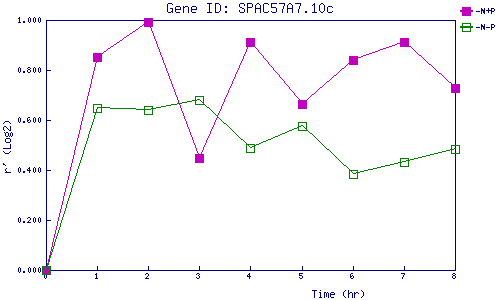
| 0 | 1 | 2 | 3 | 4 | 5 | 6 | 7 | 8 | |
| -N+P | 0.000 | 0.852 | 0.993 | 0.448 | 0.913 | 0.665 | 0.838 | 0.913 | 0.729 |
| -N-P | 0.000 | 0.647 | 0.640 | 0.681 | 0.489 | 0.575 | 0.383 | 0.433 | 0.483 |
|
-N+P: Nitrogen starved in the presence of P-factor -N-P: Nitrogen starved in the absence of P-factor |
| Gene | ||||||||||||||||||||||||||||||
sec21 |
||||||||||||||||||||||||||||||
| Gene expression upon nitrogen starvation | ||||||||||||||||||||||||||||||
|
||||||||||||||||||||||||||||||
|
|
||||||||||||||||||||||||||||||
| Values plotted in the graph | ||||||||||||||||||||||||||||||
|
|
||||||||||||||||||||||||||||||
|
||||||||||||||||||||||||||||||
| Number of mRNA in a vegetative growing cell (estimated roughly) | ||||||||||||||||||||||||||||||
|
|
||||||||||||||||||||||||||||||
|
|
||||||||||||||||||||||||||||||