| 0 | 1 | 2 | 3 | 4 | 5 | 6 | 7 | 8 | |
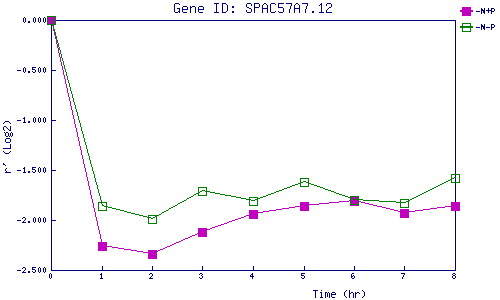
| -N+P | 0.000 | -2.255 | -2.340 | -2.122 | -1.942 | -1.855 | -1.811 | -1.929 | -1.865 |
| -N-P | 0.000 | -1.862 | -1.989 | -1.707 | -1.807 | -1.622 | -1.802 | -1.830 | -1.577 |
|
-N+P: Nitrogen starved in the presence of P-factor -N-P: Nitrogen starved in the absence of P-factor |