srb9 spTrap240
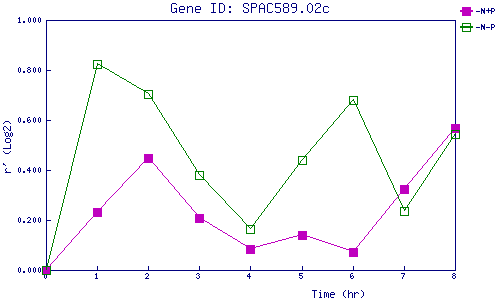
| 0 | 1 | 2 | 3 | 4 | 5 | 6 | 7 | 8 | |
| -N+P | 0.000 | 0.234 | 0.447 | 0.206 | 0.085 | 0.139 | 0.071 | 0.324 | 0.567 |
| -N-P | 0.000 | 0.822 | 0.706 | 0.380 | 0.163 | 0.440 | 0.682 | 0.237 | 0.545 |
|
-N+P: Nitrogen starved in the presence of P-factor -N-P: Nitrogen starved in the absence of P-factor |