| 0 | 1 | 2 | 3 | 4 | 5 | 6 | 7 | 8 | |
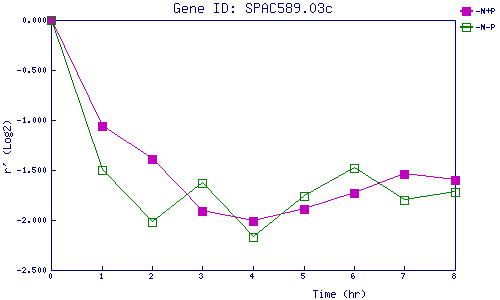
| -N+P | 0.000 | -1.059 | -1.394 | -1.913 | -2.009 | -1.890 | -1.730 | -1.542 | -1.601 |
| -N-P | 0.000 | -1.500 | -2.018 | -1.627 | -2.166 | -1.765 | -1.480 | -1.798 | -1.721 |
|
-N+P: Nitrogen starved in the presence of P-factor -N-P: Nitrogen starved in the absence of P-factor |