| 0 | 1 | 2 | 3 | 4 | 5 | 6 | 7 | 8 | |
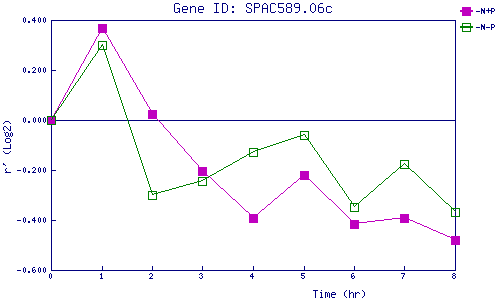
| -N+P | 0.000 | 0.369 | 0.022 | -0.204 | -0.392 | -0.220 | -0.418 | -0.391 | -0.482 |
| -N-P | 0.000 | 0.301 | -0.301 | -0.244 | -0.128 | -0.061 | -0.349 | -0.174 | -0.368 |
|
-N+P: Nitrogen starved in the presence of P-factor -N-P: Nitrogen starved in the absence of P-factor |