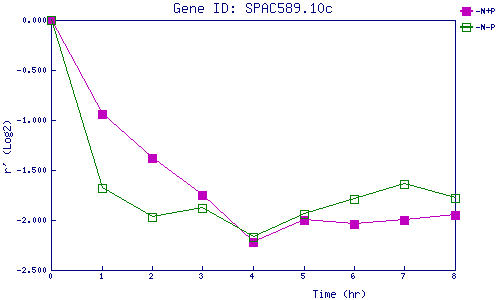
| 0 | 1 | 2 | 3 | 4 | 5 | 6 | 7 | 8 | |
| -N+P | 0.000 | -0.939 | -1.375 | -1.753 | -2.224 | -2.000 | -2.037 | -1.998 | -1.948 |
| -N-P | 0.000 | -1.685 | -1.966 | -1.883 | -2.170 | -1.941 | -1.787 | -1.638 | -1.775 |
|
-N+P: Nitrogen starved in the presence of P-factor -N-P: Nitrogen starved in the absence of P-factor |