sep11 pmc6
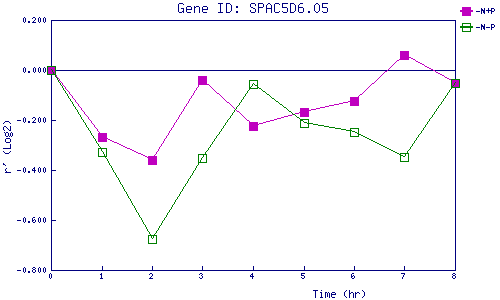
| 0 | 1 | 2 | 3 | 4 | 5 | 6 | 7 | 8 | |
| -N+P | 0.000 | -0.267 | -0.358 | -0.039 | -0.226 | -0.170 | -0.124 | 0.061 | -0.053 |
| -N-P | 0.000 | -0.330 | -0.675 | -0.351 | -0.054 | -0.212 | -0.249 | -0.349 | -0.052 |
|
-N+P: Nitrogen starved in the presence of P-factor -N-P: Nitrogen starved in the absence of P-factor |