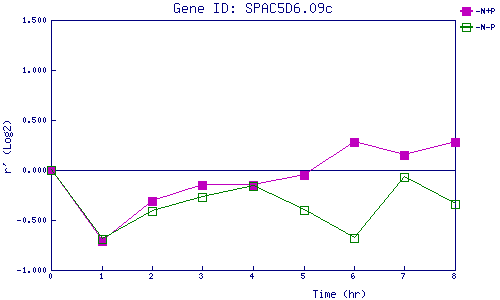
| 0 | 1 | 2 | 3 | 4 | 5 | 6 | 7 | 8 | |
| -N+P | 0.000 | -0.714 | -0.307 | -0.149 | -0.148 | -0.049 | 0.283 | 0.151 | 0.278 |
| -N-P | 0.000 | -0.686 | -0.409 | -0.269 | -0.161 | -0.398 | -0.679 | -0.066 | -0.337 |
|
-N+P: Nitrogen starved in the presence of P-factor -N-P: Nitrogen starved in the absence of P-factor |