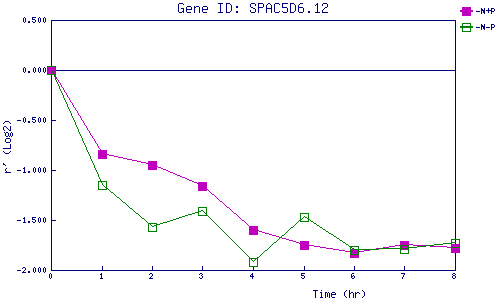
| 0 | 1 | 2 | 3 | 4 | 5 | 6 | 7 | 8 | |
| -N+P | 0.000 | -0.841 | -0.949 | -1.163 | -1.597 | -1.753 | -1.832 | -1.753 | -1.777 |
| -N-P | 0.000 | -1.146 | -1.572 | -1.408 | -1.919 | -1.469 | -1.795 | -1.790 | -1.735 |
|
-N+P: Nitrogen starved in the presence of P-factor -N-P: Nitrogen starved in the absence of P-factor |