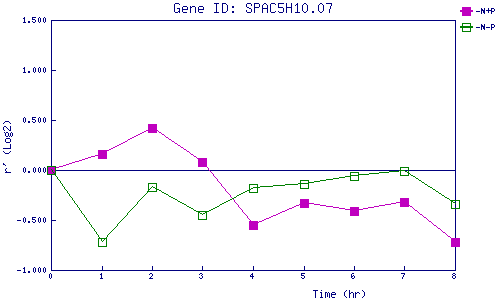
| 0 | 1 | 2 | 3 | 4 | 5 | 6 | 7 | 8 | |
| -N+P | 0.000 | 0.158 | 0.418 | 0.083 | -0.549 | -0.326 | -0.413 | -0.324 | -0.725 |
| -N-P | 0.000 | -0.723 | -0.174 | -0.452 | -0.180 | -0.138 | -0.061 | -0.008 | -0.344 |
|
-N+P: Nitrogen starved in the presence of P-factor -N-P: Nitrogen starved in the absence of P-factor |