reserved_name_pan6
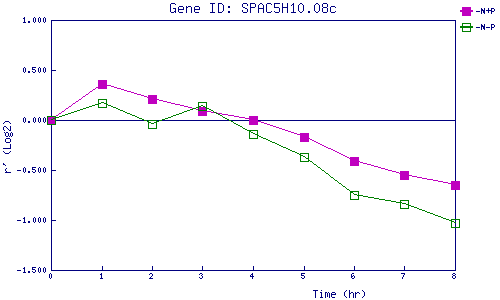
| 0 | 1 | 2 | 3 | 4 | 5 | 6 | 7 | 8 | |
| -N+P | 0.000 | 0.363 | 0.214 | 0.093 | 0.002 | -0.172 | -0.406 | -0.550 | -0.649 |
| -N-P | 0.000 | 0.169 | -0.042 | 0.140 | -0.137 | -0.366 | -0.754 | -0.837 | -1.033 |
|
-N+P: Nitrogen starved in the presence of P-factor -N-P: Nitrogen starved in the absence of P-factor |