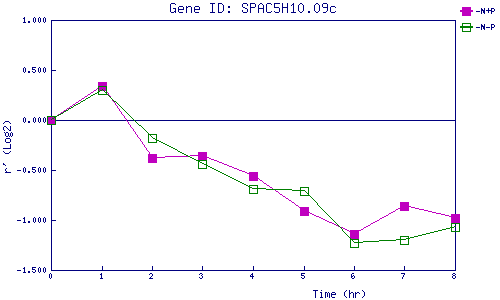
| 0 | 1 | 2 | 3 | 4 | 5 | 6 | 7 | 8 | |
| -N+P | 0.000 | 0.340 | -0.379 | -0.360 | -0.555 | -0.911 | -1.140 | -0.856 | -0.979 |
| -N-P | 0.000 | 0.299 | -0.177 | -0.439 | -0.692 | -0.710 | -1.229 | -1.198 | -1.067 |
|
-N+P: Nitrogen starved in the presence of P-factor -N-P: Nitrogen starved in the absence of P-factor |