| 0 | 1 | 2 | 3 | 4 | 5 | 6 | 7 | 8 | |
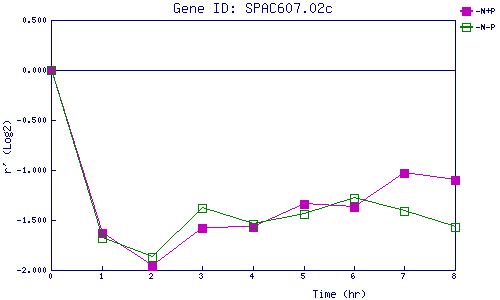
| -N+P | 0.000 | -1.629 | -1.962 | -1.586 | -1.574 | -1.342 | -1.368 | -1.033 | -1.101 |
| -N-P | 0.000 | -1.680 | -1.872 | -1.385 | -1.536 | -1.437 | -1.282 | -1.414 | -1.570 |
|
-N+P: Nitrogen starved in the presence of P-factor -N-P: Nitrogen starved in the absence of P-factor |