snu13
| 0 | 1 | 2 | 3 | 4 | 5 | 6 | 7 | 8 | |
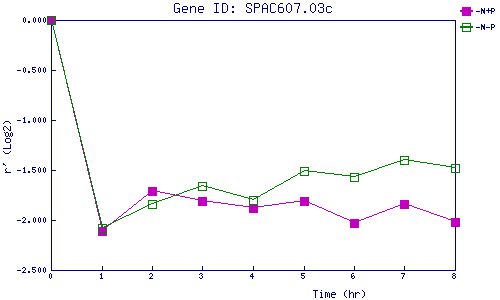
| -N+P | 0.000 | -2.110 | -1.710 | -1.809 | -1.875 | -1.811 | -2.028 | -1.840 | -2.024 |
| -N-P | 0.000 | -2.081 | -1.835 | -1.662 | -1.804 | -1.508 | -1.573 | -1.403 | -1.482 |
|
-N+P: Nitrogen starved in the presence of P-factor -N-P: Nitrogen starved in the absence of P-factor |