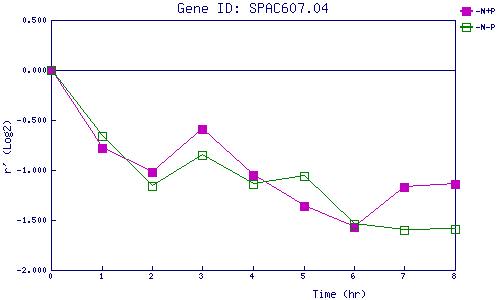
| 0 | 1 | 2 | 3 | 4 | 5 | 6 | 7 | 8 | |
| -N+P | 0.000 | -0.785 | -1.019 | -0.589 | -1.053 | -1.361 | -1.569 | -1.172 | -1.144 |
| -N-P | 0.000 | -0.662 | -1.156 | -0.853 | -1.138 | -1.057 | -1.539 | -1.604 | -1.594 |
|
-N+P: Nitrogen starved in the presence of P-factor -N-P: Nitrogen starved in the absence of P-factor |