rpn9
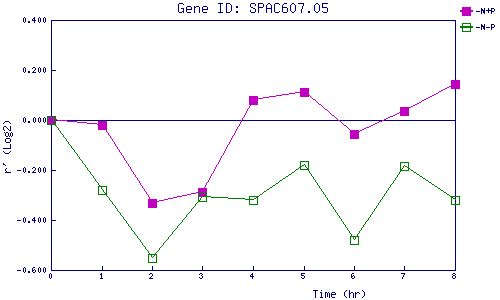
| 0 | 1 | 2 | 3 | 4 | 5 | 6 | 7 | 8 | |
| -N+P | 0.000 | -0.019 | -0.332 | -0.287 | 0.078 | 0.112 | -0.057 | 0.037 | 0.145 |
| -N-P | 0.000 | -0.279 | -0.550 | -0.309 | -0.321 | -0.179 | -0.479 | -0.183 | -0.320 |
|
-N+P: Nitrogen starved in the presence of P-factor -N-P: Nitrogen starved in the absence of P-factor |