spo3
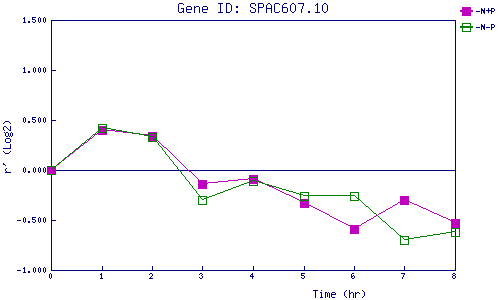
| 0 | 1 | 2 | 3 | 4 | 5 | 6 | 7 | 8 | |
| -N+P | 0.000 | 0.402 | 0.345 | -0.137 | -0.088 | -0.333 | -0.592 | -0.303 | -0.534 |
| -N-P | 0.000 | 0.417 | 0.328 | -0.302 | -0.110 | -0.258 | -0.259 | -0.699 | -0.623 |
|
-N+P: Nitrogen starved in the presence of P-factor -N-P: Nitrogen starved in the absence of P-factor |