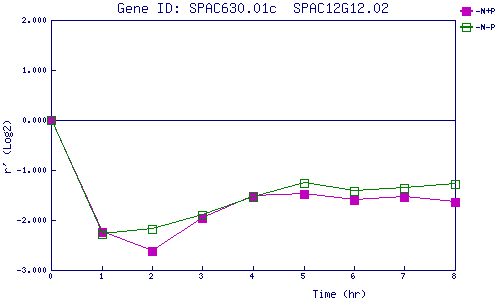
| 0 | 1 | 2 | 3 | 4 | 5 | 6 | 7 | 8 | |
| -N+P | 0.000 | -2.241 | -2.612 | -1.963 | -1.521 | -1.485 | -1.608 | -1.540 | -1.633 |
| -N-P | 0.000 | -2.283 | -2.171 | -1.899 | -1.539 | -1.259 | -1.414 | -1.359 | -1.281 |
|
-N+P: Nitrogen starved in the presence of P-factor -N-P: Nitrogen starved in the absence of P-factor |