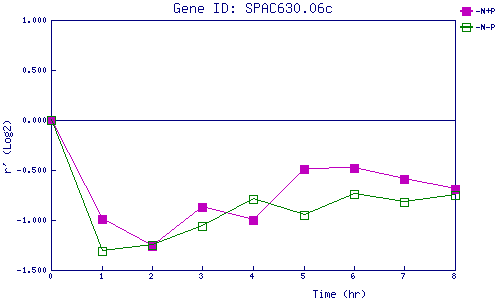
| 0 | 1 | 2 | 3 | 4 | 5 | 6 | 7 | 8 | |
| -N+P | 0.000 | -0.989 | -1.261 | -0.868 | -0.998 | -0.493 | -0.485 | -0.586 | -0.694 |
| -N-P | 0.000 | -1.311 | -1.251 | -1.058 | -0.786 | -0.953 | -0.735 | -0.818 | -0.748 |
|
-N+P: Nitrogen starved in the presence of P-factor -N-P: Nitrogen starved in the absence of P-factor |