| 0 | 1 | 2 | 3 | 4 | 5 | 6 | 7 | 8 | |
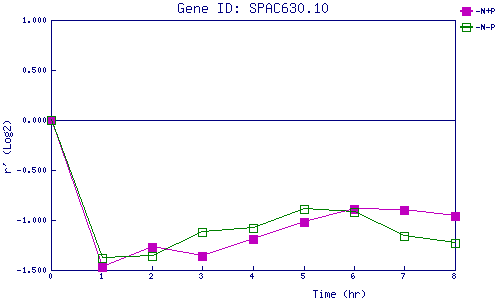
| -N+P | 0.000 | -1.473 | -1.268 | -1.359 | -1.192 | -1.022 | -0.891 | -0.898 | -0.960 |
| -N-P | 0.000 | -1.380 | -1.364 | -1.116 | -1.077 | -0.893 | -0.924 | -1.161 | -1.234 |
|
-N+P: Nitrogen starved in the presence of P-factor -N-P: Nitrogen starved in the absence of P-factor |