tup1 tup12
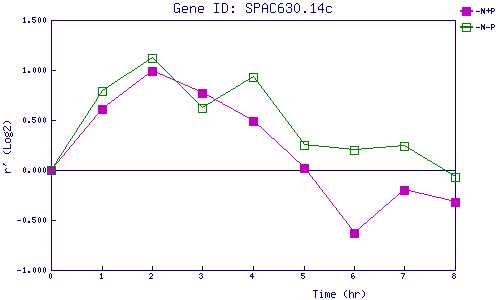
| 0 | 1 | 2 | 3 | 4 | 5 | 6 | 7 | 8 | |
| -N+P | 0.000 | 0.611 | 0.992 | 0.770 | 0.494 | 0.021 | -0.626 | -0.199 | -0.324 |
| -N-P | 0.000 | 0.787 | 1.121 | 0.616 | 0.929 | 0.249 | 0.202 | 0.236 | -0.073 |
|
-N+P: Nitrogen starved in the presence of P-factor -N-P: Nitrogen starved in the absence of P-factor |