moe1
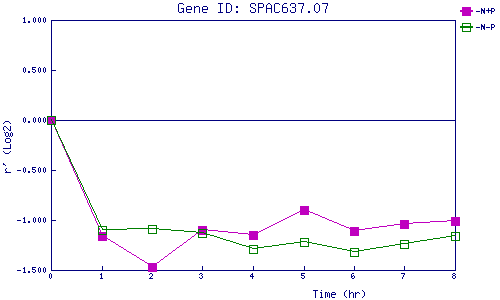
| 0 | 1 | 2 | 3 | 4 | 5 | 6 | 7 | 8 | |
| -N+P | 0.000 | -1.161 | -1.470 | -1.095 | -1.149 | -0.900 | -1.107 | -1.039 | -1.013 |
| -N-P | 0.000 | -1.097 | -1.091 | -1.126 | -1.293 | -1.218 | -1.325 | -1.240 | -1.165 |
|
-N+P: Nitrogen starved in the presence of P-factor -N-P: Nitrogen starved in the absence of P-factor |