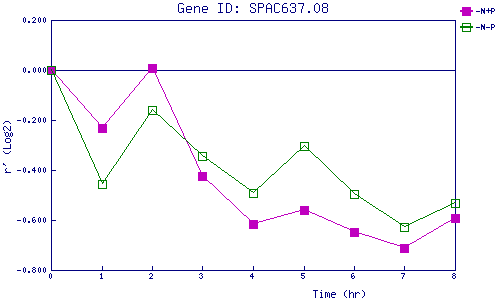
| 0 | 1 | 2 | 3 | 4 | 5 | 6 | 7 | 8 | |
| -N+P | 0.000 | -0.232 | 0.007 | -0.424 | -0.614 | -0.558 | -0.648 | -0.711 | -0.594 |
| -N-P | 0.000 | -0.458 | -0.162 | -0.344 | -0.491 | -0.302 | -0.495 | -0.629 | -0.532 |
|
-N+P: Nitrogen starved in the presence of P-factor -N-P: Nitrogen starved in the absence of P-factor |