| 0 | 1 | 2 | 3 | 4 | 5 | 6 | 7 | 8 | |
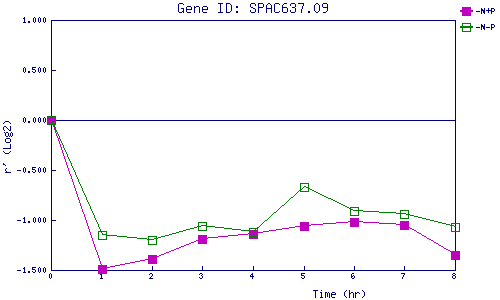
| -N+P | 0.000 | -1.492 | -1.390 | -1.187 | -1.142 | -1.055 | -1.023 | -1.049 | -1.349 |
| -N-P | 0.000 | -1.146 | -1.204 | -1.064 | -1.118 | -0.667 | -0.910 | -0.942 | -1.073 |
|
-N+P: Nitrogen starved in the presence of P-factor -N-P: Nitrogen starved in the absence of P-factor |