pus1 rpn10
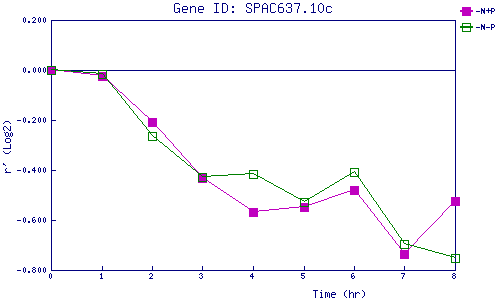
| 0 | 1 | 2 | 3 | 4 | 5 | 6 | 7 | 8 | |
| -N+P | 0.000 | -0.023 | -0.206 | -0.430 | -0.570 | -0.548 | -0.479 | -0.734 | -0.525 |
| -N-P | 0.000 | -0.015 | -0.264 | -0.428 | -0.418 | -0.528 | -0.406 | -0.694 | -0.752 |
|
-N+P: Nitrogen starved in the presence of P-factor -N-P: Nitrogen starved in the absence of P-factor |